Global Markets Update: What’s Moving Prices Today

Global markets update: prices across stocks, bonds, oil, gold, and currencies are being pulled by a handful of powerful forces sometimes in the same direction, sometimes in opposite directions. If it feels like “everything is moving at once,” that’s because modern markets are tightly connected. A shift in interest-rate expectations can ripple into the US dollar, reshape oil demand, influence inflation forecasts, and feed back into bond yields and stock valuations.
The good news is you don’t need a finance degree to follow the story. You just need a clear map of the drivers that matter most and a simple way to tell whether today’s moves are about growth, inflation, policy, or positioning.
This guide explains what’s moving prices today in plain English, using real-world examples, practical indicators to watch, and a quick “5-minute market read” you can use daily.
First, a quick reality check: “Today” can be a holiday market
Depending on the calendar, “today” may not be a full trading day everywhere. For example, January 1, 2026 is a public holiday in many countries and several major venues close for New Year’s Day. In the US, New Year’s Day is also widely treated as a day when stock markets are closed.
At the same time, not every market follows the exact same holiday pattern. Some countries can have different trading arrangements, and local schedules may diverge from the US and Europe.
Why this matters: holiday conditions can mean thin liquidity fewer active traders so prices may drift on smaller orders, and headlines can move markets more than usual.
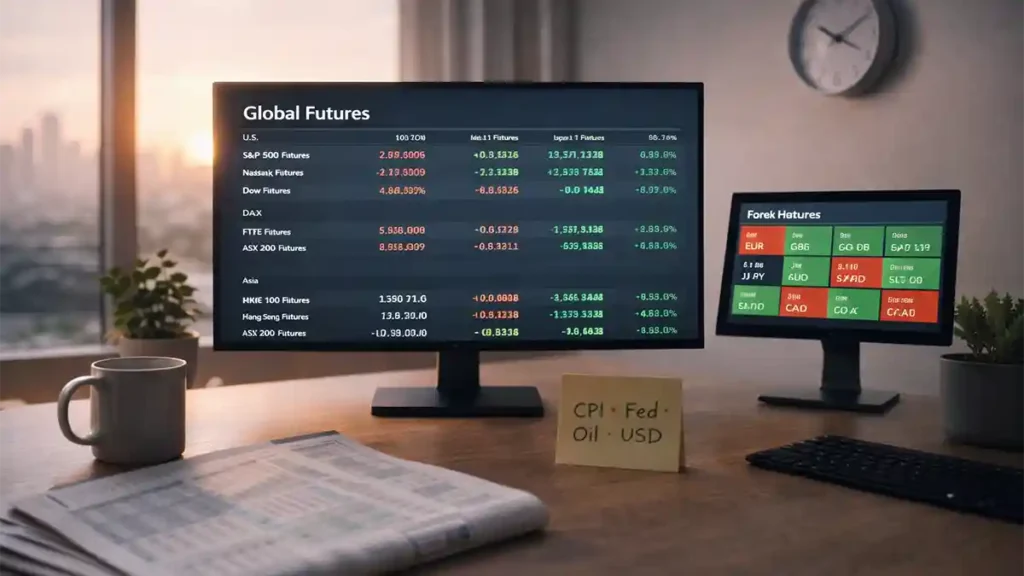
The “today dashboard”: a simple cross-market snapshot
Instead of staring at one chart, look at the whole dashboard. Here are reference points using widely followed ETFs and benchmarks (useful proxies when different regions are closed at different times):
- US stocks (broad): SPY ~ 681.92
- US tech-heavy stocks: QQQ ~ 614.31
- Developed markets ex-US: EFA ~ 96.03
- Japan equities proxy: EWJ ~ 80.74
- China large-caps proxy: FXI ~ 38.29
- Emerging markets proxy: EEM ~ 54.71
- Gold proxy: GLD ~ 396.31
- Oil proxy: USO ~ 69.16
- US dollar proxy: UUP ~ 27.03
- Bitcoin: ~ 88,088
You don’t need to memorize these numbers. What matters is the pattern:
- If stocks fall while the dollar rises, it often signals risk-off stress or tighter financial conditions.
- If oil drops sharply, inflation expectations can cool and central-bank pressure may ease.
- If gold rises alongside a weaker dollar, markets may be hedging uncertainty or policy risk.
The 4 engines that move prices most days
Most daily moves trace back to four big engines:
- Interest rates & bond yields (the “price of money”)
- The US dollar (the global pricing currency)
- Energy & commodities (inflation pulse + growth signal)
- Earnings & guidance (the corporate reality check)
Everything else politics, geopolitics, supply chains, even social media noise usually influences markets through one of these channels.
Let’s break them down clearly.
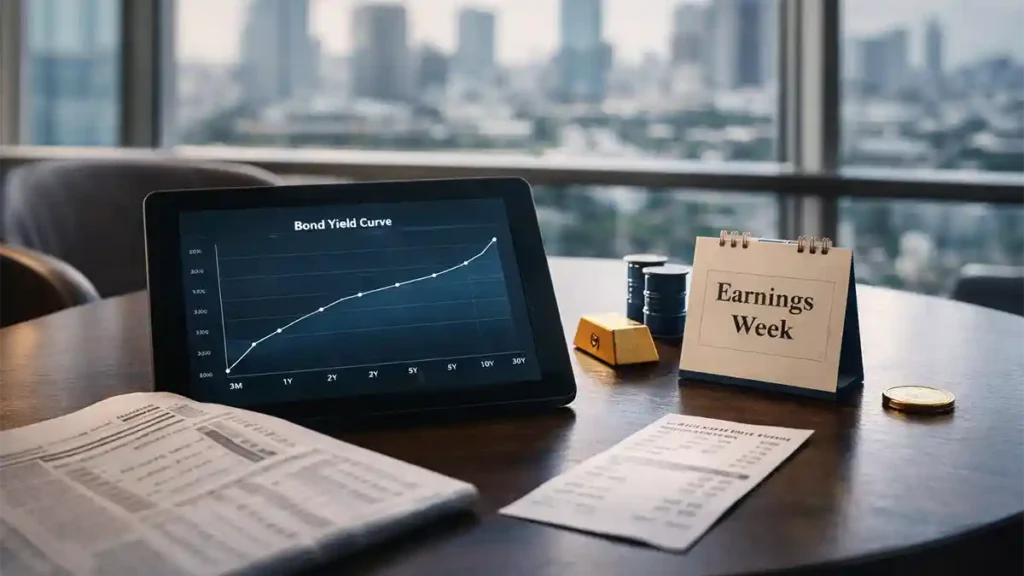
(1) Bond yields: why “the price of money” sets the mood
When people say, “Markets are watching rates,” they mean investors are trying to predict where borrowing costs are heading and how long they stay there.
Why yields move prices everywhere
Bond yields matter because they sit underneath almost every asset:
- Stocks: Higher yields often reduce the present value of future profits (especially for high-growth tech).
- Housing: Higher rates can cool mortgages and construction demand.
- Currencies: Higher yields can attract capital, strengthening a currency.
- Emerging markets: A strong dollar plus high US yields can pressure financing costs.
The key idea: markets trade the direction of policy expectations
A practical way to understand the rates story is to watch how central-bank projections and inflation trends line up.
For example, the US Federal Reserve’s December 2025 economic projections showed a median view of:
- 2026 GDP growth: 2.3%
- 2026 PCE inflation: 2.4%
- Projected federal funds rate (end-2026): 3.4%
Those numbers don’t tell you exactly what happens today. But they define the debate markets trade daily: Is inflation cooling fast enough? Will growth hold up? Does the central bank keep rates restrictive, or start easing?
What to watch today (rates edition)
If you want a quick read without drowning in jargon, check:
- Any surprise inflation headlines (food, energy, services)
- Comments from central-bank officials (hawkish vs dovish tone)
- Big bond auctions (they can move yields if demand looks weak)
- Risk events (geopolitics can push investors into “safe” government bonds)
Simple translation:
- Falling yields often support stocks (especially growth).
- Rising yields can pressure stocks, lift the dollar, and tighten conditions.
(2) The US dollar: the “hidden hand” behind many price moves
The dollar is not just a currency it’s the global reference point for trade, commodities, and capital flows.
Why the dollar changes commodity prices
Most commodities are priced in dollars. If the dollar strengthens, buyers using other currencies effectively pay more, which can cool demand and pressure prices.
That’s one reason you’ll often see:
Dollar up → commodities down (not always, but common)
A quick proxy for broad dollar moves is UUP.
Why the dollar can stress emerging markets
Many emerging economies borrow in dollars or depend on dollar-based trade finance. A strong dollar can tighten global financial conditions even if local economies are doing fine.
Practical takeaway: if your “stock market today” story feels confusing, check the dollar. A rising dollar often explains why global risk assets struggle even when local news looks okay.
(3) Oil and commodities: the inflation pulse and the growth signal
Energy and commodities can move markets for two big reasons:
- They affect inflation (fuel, transport, food, utilities)
- They signal global demand (manufacturing, shipping, construction)
Oil’s recent story: supply vs demand is back in focus
Oil prices can fall even during geopolitical tension if markets believe supply is ample or demand is softer.
Longer-horizon outlooks have also pointed to an easing commodity environment. For example, the World Bank’s Commodity Markets Outlook (Oct 2025) projected overall commodity prices to decline and described expectations for softer energy pricing into 2026.
Why “oil down” can be good news and bad news
Oil down can mean:
- Good: less inflation pressure → potential for easier policy → consumer relief
- Bad: weaker demand expectations → growth worries → energy sector earnings pressure
So the market reaction depends on why oil is falling.
Metals and industrial commodities: the “real economy” thermometer
Industrial commodities (like copper) tend to reflect expectations about construction, manufacturing, and infrastructure cycles. If markets fear a slowdown, these prices often soften first.
Quick way to interpret commodity prices today:
- If commodities fall alongside weaker global equities, that can be a growth warning.
- If commodities fall while equities rise, markets may be celebrating cooling inflation.
(4) Earnings and guidance: the moment markets meet reality
Earnings season can overpower everything else. Even if macro news is quiet, a few major companies can swing an entire index.
What markets actually trade
Not the “earnings beat” headline markets trade:
- Forward guidance (what companies expect next)
- Margins (cost pressures, wage growth, pricing power)
- Demand tone (“customers are cautious” vs “orders are strong”)
Why guidance matters more than profits
Markets are forward-looking. A company can report strong past results but warn that next quarter looks weaker and the stock can drop.
Today’s practical lens: if stocks are moving “for no reason,” check whether:
- A major sector (tech, energy, banks) is reacting to a guidance change
- Analysts are revising expectations quickly
- Investors are rotating between “defensive” and “growth” themes
The bigger backdrop: growth is steady, but markets debate the pace
Daily market moves feel chaotic, but they sit inside a broader global picture.
The IMF’s World Economic Outlook (Oct 2025) projected global growth easing from 3.3% (2024) to 3.2% (2025) and 3.1% (2026).
That kind of outlook supports an environment where:
- Investors look for “soft landing” signals
- Inflation cooling matters a lot
- Policy and rates remain the key swing factor
Translation: markets can rally and sell off within the same week because they’re constantly updating the same question: are we heading toward stable growth with easing inflation, or a slowdown that forces a bigger reset?
Why markets sometimes don’t match the headlines
A common frustration: you read a scary headline, but stocks rise. Or you read good news, but markets fall.
That’s usually because markets trade surprise vs expectation, not “good vs bad.”
Example: inflation falls but stocks drop
If investors expected inflation to fall more, the result can still disappoint. The reaction becomes: “Rates might stay higher for longer.”
Example: oil falls and stocks fall too
Oil falling can be interpreted as a sign that global demand is weakening bad for growth and profits.
Example: strong jobs report but tech dips
A strong jobs report can push yields up (inflation concern), pressuring long-duration growth stocks.
Rule of thumb: don’t ask “Is the news good?” Ask: “Is it better or worse than what investors priced in?”
The mechanics many people miss: flows, positioning, and options
Not every move is fundamental. Some moves are mechanical:
- Portfolio rebalancing at month-end or year-end
- Hedging activity in options markets
- Stop-loss triggers (automatic selling after a level breaks)
- Low-liquidity holiday trading (small orders cause larger moves)
That’s why you can see a day where nothing “big” happens, yet prices move quickly.
Practical takeaway: if a move looks exaggerated, check whether it’s a thin session, a rebalancing window, or a major options expiration period.
A 5-minute routine to understand what’s moving prices today
If you only have five minutes, do this in order:
- Are bond yields rising or falling? (risk-on vs risk-off signal)
- Is the dollar strengthening or weakening? (global conditions)
- What is oil doing, and why? (inflation vs demand story)
- Any major earnings or guidance headlines? (index drivers)
- Is there a major macro event today or tomorrow? (CPI, jobs, central bank)
If you do those five checks, you’ll understand most daily moves better than most hot takes.
What to watch next: the short list that actually matters
Markets keep re-pricing the same set of forward risks:
(1) The “rate path” debate
Central-bank projections and data points (inflation, jobs, growth) feed into a daily tug-of-war on policy expectations. Projections help define the policy “center,” but the range of outcomes remains wide.
(2) Energy and the inflation narrative
Oil and energy prices influence inflation perceptions and consumer sentiment. Supply expectations, demand signals, and inventory trends often explain oil moves better than headlines.
(3) Global growth and fragmentation risk
The outlook highlights slower growth and persistent vulnerabilities. That keeps investors sensitive to trade, policy uncertainty, and regional slowdowns.
(4) Currency pressure points
Dollar strength can tighten conditions globally, especially for riskier assets and emerging markets.
Common questions readers ask (and clear answers)
Why do stocks and bonds sometimes move in the same direction?
Because markets can be trading the same fear: growth risk. In risk-off moments, stocks fall and investors buy bonds, pushing yields down. In other regimes, inflation can pressure both.
Why does tech react so strongly to yields?
Tech and growth stocks are valued on future earnings. Higher yields raise discount rates, which can reduce valuations even if companies are performing well.
Does oil always move inflation?
Oil influences inflation expectations, but actual consumer inflation depends on many factors such as services, wages, and housing.
Why do currencies move before stocks?
FX reacts quickly to rate differentials and macro surprises. Currency moves can then feed into multinational earnings and commodity prices.
How can I tell if a move is real or just noise?
Look for confirmation across the dashboard: yields, the dollar, oil, and equities pointing to a consistent story.
Quick FAQ
Q1: What moves global prices fastest today?
Rates expectations, the US dollar, oil, and earnings headlines.
Q2: Why does the dollar matter so much?
It shapes global capital flows and dollar-priced commodities.
Q3: Is falling oil always good?
No, good for inflation, sometimes bad if it signals weaker demand.
Q4: What’s the easiest market check?
Yields direction + dollar direction + oil trend.
Q5: Why do markets move on quiet days?
Positioning, options hedging, and low liquidity.
Conclusion: a smarter way to follow global markets without the stress
A global markets update doesn’t have to feel like decoding chaos. Most days, prices move for a small set of reasons: rate expectations, the dollar, energy and commodity signals, and earnings reality. The rest is timing, positioning, or liquidity.
If you take one idea from this article, let it be this: markets are forward-looking. They don’t react to headlines they react to how headlines change expectations.
Use the 5-minute routine, watch the dashboard instead of a single chart, and you’ll start seeing patterns instead of noise. That’s how professionals stay calm and how you can understand what’s moving prices today with clarity.


Gold market moving fastly so all the world busy on it. In that time I think gold is better product in the current time